GOV.UK has a lot of content, and one piece of content can “link” to another. I’m not talking about links inside the HTML here, these links live in the metadata of a piece of content. For example, the “keeping a pet pig or ‘micropig’” guidance links to:
- A document collection: Keeping sheep, goats, pigs and deer.
- Two organisations: the Department for Environment Food & Rural Affairs and the Animal and Plant Health Agency.
- A policy area: Wildlife and animal welfare.
- A guide: Register land you use to keep livestock.
- A taxon: Wildlife, animals, biodiversity and ecosystems.
- And a bunch of suggested related items.
These are all visible in the JSON content item for the page.
If we plotted all 500,000ish pieces of GOV.UK content as a graph (content items being nodes and links being edges), would we learn anything interesting? Maybe, maybe not. I tried it and here are some of the better subgraphs I found.
People
Some content items are associated with a person. An organisation will have people (who are not ministers), and it may also have ministers. A speech will have a speaker. And so on. Here is a network showing all content linked to a person:
You can see larger clusters around more significant figures, like David Cameron or Theresa May.
I rendered this using Gephi, an open-source graph visualisation program. Gephi supports many graph operations, such as finding the ego network of a node. A node’s ego network is all the other nodes that it shares an edge (in any direction) with. Here is the same network but with the colours adjusted to highlight David Cameron’s ego network:
It’s mostly concentrated in the cluster surrounding his node, but not entirely.
The people network, however, is boring. There are people, which only have inbound edges; and other content, which only has outbound edges. Let’s look at something a little more interesting.
Step-by-steps
Step-by-steps are a relatively new feature of GOV.UK, introduced a couple of quarters ago. They’re designed to walk people through completing a task, which may involve several steps and multiple government departments; part of the GOV.UK ideal is that people shouldn’t need to understand the structure of government in order to interact with government. An example step-by-step is how to get a student loan.
There aren’t that many of them yet, so this is a fairly sparse network:
But we can see some structure. For example, there’s a cluster of step-by-steps about driving instruction:
Marriage, on the other hand, is a lonely endeavour:

Organisations
Organisations show up in links a lot:
- Organisations can link to organisations, through parent/child relationships.
- Content links to the organisations it’s related to.
- Content links to the organisations responsible for publishing it.
The structure of the organisation network looks like this:
Some organisations are linked to multiple others. I guess this means that the child organisation is run as a collaboration under both of the others. For instance, the organisation linked to both BEIS and DCMS is the Office for Artificial Intelligence.
As we’ll see in the next two subsections, an organisation with a lot of related organisations (like BEIS) doesn’t necessarily have a lot of content.
Content linking to its related organisations
This is pretty messy, it’s good that you usually don’t need to know about organisations when navigating GOV.UK!
This network is coloured by closeness centrality, which is a measure of the average distance from a node to every other node in the network. We see these clusters of colour because of three structural properties:
- All nodes are either a content node or an organisation node.
- Content nodes only have outgoing edges, and these edges point to organisation nodes.
- Organisation nodes have edges going to and from other organisation nodes.
The organisation–organisation links give organisations a variety of closeness centralities, and all of the content linked to an organisation has roughly the same closeness centrality as the organisation itself; it’s only one more edge away.
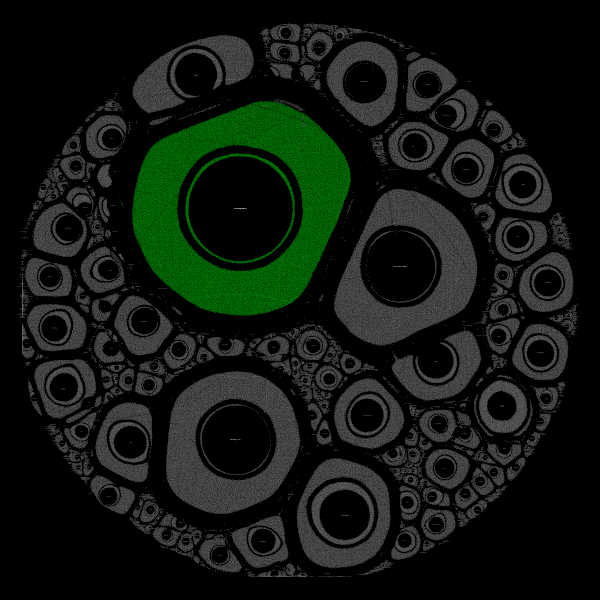
It’s apparent that not all organisations are created equal, some have a far greater volume of content than others. HMRC’s ego network contains 19.7% of all nodes in the network:
Unlike David Cameron, HMRC has a huge ego network. Though, I bet a large chunk of that is the HMRC internal manuals, which very few people care about.1
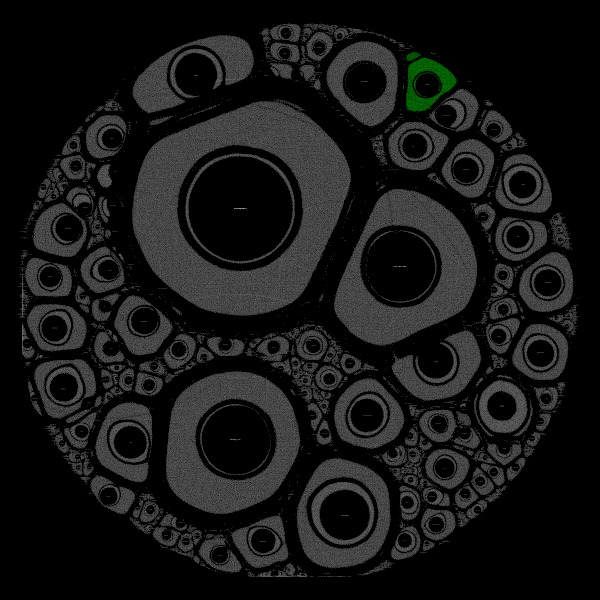
In contrast, GDS does quite poorly with only 0.2% of the nodes:

But that’s ok; it’s all about quality, not quantity.
Content linking to its publishing organisations
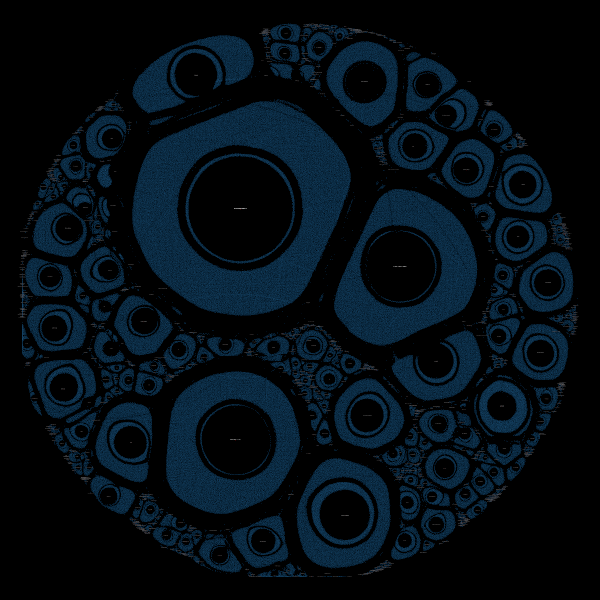
This graph is coloured in the same way as in the previous subsection, but it’s a lot more monochrome. This is because we’ve lost the organisation–organisation links, so the network is much more disconnected.
There’s an interesting double-ring pattern around most of the organisations. I don’t know what it means here, because the only links are to do with the publishing organisation.
Disappointingly, HMRC’s ego network has increased to 21.4% of the nodes:
GDS now has 1.2% of the nodes:
The taxonomy
The taxonomy is the current blessed way to organise content on GOV.UK2. The idea is to fit all content into a tree, the structure of which makes sense to people other than just publishers.
Taxon pages look like this. The tree structure of the taxonomy, it turns out, looks like this:
It doesn’t look much like a tree, so I’ve probably conflated a few different link types. For instance, the network includes “alpha” taxons, “legacy” taxons, and “topic taxonomy” taxons; none of which I knew of before.
And here’s what it looks like with all the content items as well:
Did we learn anything?
Probably not3, but there were some nice graphs.
I particularly liked the organisations and related content one, that could almost be a poster.
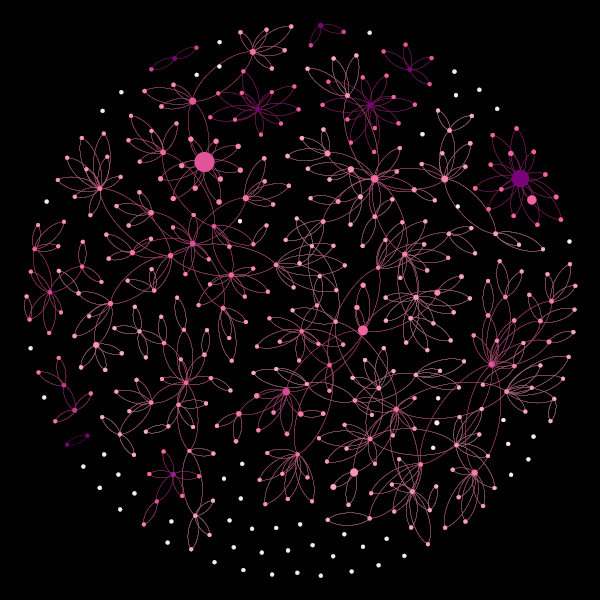
Here’s a bonus light version of the people graph:
Appendix: Gephi input files
Here are the csv files I used with Gephi:
- all-links.csv.gz
- organisations.csv.gz
- people.csv.gz
- publishing-organisations.csv.gz
- step-by-step.csv.gz
- taxonomy.csv.gz
Appendix: Script to generate the Gephi input files
This script isn’t particularly useful unless you have a dump of the GOV.UK content store, in which case you’ve either worked for GDS or you’re a hacker. But in the interest of completeness, here it is:
#! /usr/bin/env nix-shell
#! nix-shell -i python3 --packages "python3.withPackages(ps: [ps.pymongo])"

from pymongo import MongoClient
import csv
import os
import sys

ALL_LINKS_CATEGORY = 'all-links'
LINK_CATEGORIES = {
    'organisations': ['lead_organisations', 'ordered_child_organisations', 'ordered_high_profile_groups', 'ordered_parent_organisation', 'ordered_successor_organisations', 'organisations', 'supporting_organisations', 'worldwide_organisations'],
    'people': ['ministers', 'people', 'speaker'],
    'publishing-organisations': ['original_primary_publishing_organisation', 'primary_publishing_organisation'],
    'step-by-step': ['pages_part_of_step_nav', 'pages_related_to_step_nav', 'part_of_step_navs', 'related_to_step_navs'],
    'taxonomy': ['alpha_taxons', 'associated_taxons', 'child_taxons', 'legacy_taxons', 'level_one_taxons', 'parent_taxons', 'root_taxon', 'taxons', 'topic_taxonomy_taxons'],
}

if 'SHOW_CATEGORIES' in os.environ:
    print(ALL_LINKS_CATEGORY)
    for category in LINK_CATEGORIES.keys():
        print(category)
    sys.exit(0)

MONGO_URL = os.environ['MONGO_URL']
CSV_FILE = os.environ.get('CSV_FILE', 'links.csv')
LINK_CATEGORY = os.environ.get('LINK_CATEGORY', ALL_LINKS_CATEGORY)


def includes(linkty):
    if LINK_CATEGORY == ALL_LINKS_CATEGORY:
        return True
    return linkty in LINK_CATEGORIES[LINK_CATEGORY]


documents = MongoClient(MONGO_URL).content_store['content_items'].find({})

with open(CSV_FILE, 'w', newline='') as csvfile:
    writer = csv.writer(csvfile, delimiter=';', quotechar='"', quoting=csv.QUOTE_MINIMAL)
    for document in documents:
        links = []
        for linkty, links_of_type in document.get('expanded_links', {}).items():
            if includes(linkty):
                links.extend(link['base_path'] for link in links_of_type if 'base_path' in link)
        if links != []:
            writer.writerow([document['_id']] + links)
This assumes you have access to a copy of the live content store database running in mongodb somewhere. If you do, you can generate all of the csv files like so:
for category in $(./path/to/script.py); do
  echo "Generating ${category}..."
  MONGO_URL="mongodb://host:port" CSV_FILE="${category}.csv" LINK_CATEGORY=$category ./path/to/script.py
done