hledger is a plain-text accounting tool for keeping track of your finances. I’ve been using it for nearly a year now, and am pretty sold on it. Grafana is a graphing tool which supports data from a variety of sources, which I’ve recently become a fan of.
Wouldn’t it be nice if we could get Grafana and hledger talking, and graph our finances?
Well, we can! We’ll use InfluxDB as the data source (Grafana doesn’t store the data by itself), so first we need to set that up. If you’re on NixOS add these two lines to your configuration.nix:
services.influxdb.enable = true;
services.grafana.enable  = true;
This will start InfluxDB and Grafana, the latter accessible at http://localhost:3000, with default passwords. See the security options if you want to run these in production. If you’re not on NixOS, you’ll have to check your documentation, but it’s probably simple.
Getting InfluxDB and Grafana talking
Firstly, create a database in InfluxDB called “finance”.
Then, open Grafana (http://localhost:3000 by default) in your web browser. You’ll be prompted to add a data source. The form is pretty clear but, just in case you have any difficulty, here are the settings I used for the default InfluxDB configuration:
- Name: influxdb
- Type: InfluxDB
- Http Settings:
- Url: http://localhost:8086
- Access: proxy
- Http Auth: no boxes checked
- InfluxDB Details:
- Database: finance
- User: root
- Password: root
- Default group by time: empty
The page will update to tell you if there is a problem.
Getting hledger and InfluxDB talking
Let’s work through a small program to copy hledger data to InfluxDB together. Firstly, we’ll need the hledger-lib and influxdb packages from Hackage. Then there’s some boilerplate of imports and suchlike:
{-# LANGUAGE OverloadedStrings #-}

import Data.Function (on)
import Data.List (inits, groupBy, mapAccumL, nub)
import qualified Data.Map as M
import Data.String (fromString)
import qualified Data.Text as T
import Data.Time.Clock (UTCTime(..))
import Database.InfluxDB as I
import Hledger.Data.Types as H
import Hledger.Read as H
Because I am a lazy person who does not like writing programs which do more than I need, our main function will just dump the entire contents of the default journal into InfluxDB:
main :: IO ()
main = do
  journal <- H.defaultJournal
  let measurements = toMeasurements (H.jtxns journal)
  I.writeBatch (I.writeParams "finance") measurements
  putStrLn $ "Wrote " ++ show (length measurements) ++ " measurements."
Both the hledger and InfluxDB APIs are involved here, so let’s unpack it a little:
- Read the default journal file, which is in the
LEDGER_FILEenvironment variable. - Convert all the transactions into InfluxDB measurements.
- Write all those measurements to the InfluxDB “finance” database.
A fancier main function would allow giving a date to include transactions after (so you can run this daily), and the name of the database.
Reporting deltas
The magic all happens in the toMeasurements function:
toMeasurements :: [H.Transaction] -> [I.Line UTCTime]
toMeasurements = map toInflux
According to the best principles of functional programming, we’ll just have that be a small function which does one thing and one thing well, by composing existing functions. We’ll work through a few versions of this. The real magic all happens inside the toInflux function:
toInflux :: H.Transaction -> I.Line UTCTime
toInflux txn = Line "delta" tags fields (Just time) where
  time   = UTCTime (H.tdate txn) 0
  tags   = M.singleton "description" (fixup (H.tdescription txn))
  fields = fmap I.FieldFloat (toDeltas txn)
For each transaction we produce a Line, which is one InfluxDB measurement. A line has a measurement name, some tags, some fields, and the time the measurement was taken. We have one tag, the description, and for the time we’re using midnight on the day of the transaction1.
The fixup function removes commas and spaces (forbidden!) from the description:
fixup :: T.Text -> T.Text
fixup = T.replace "," "_" . T.replace " " "_"
The really real magic happens in toDeltas, which takes a transaction and produces the collection of balance changes:
toDeltas :: H.Transaction -> M.Map I.Key Double
toDeltas txn =
    let postings = concatMap explodeAccount (H.tpostings txn)
        accounts = nub (map H.paccount postings)
    in M.fromList [ (fromString (T.unpack a), val)
                  | a <- accounts
                  , let ps  = filter ((==a) . H.paccount) postings
                  , let val = sum (map (value . H.pamount) ps)
                  ]
We’re producing one entry in our map for every account involved in the transaction, where the value is the total change to that account. The closest type of value, which InfluxDB supports, to what we want is double2.
Grafana cannot sum different timeseries as far as I’m aware (there is a feature request open for timeseries arithmetic), so we need to aggregate changes in subaccounts into changes in superaccounts ourselves. If I report a deposit of £x into assets:santander:main, I also want that to show up as a £x increase in assets:santander and assets. The explodeAccount function duplicates postings to achieve this:
explodeAccount :: H.Posting -> [H.Posting]
explodeAccount p =
  [ p { H.paccount = a }
  | a <- tail . map (T.intercalate ":") . inits . T.splitOn ":" $ H.paccount p
  ]
Finally we have value, which converts an hledger value into a double:
value :: H.MixedAmount -> Double
value (H.Mixed amounts) = sum (map go amounts) where
  go (H.Amount "£" q _ _) = fromRational (toRational q)
  go (H.Amount _   _ (H.TotalPrice a) _) = go a
This is partial but, again, I am lazy and it works for me.
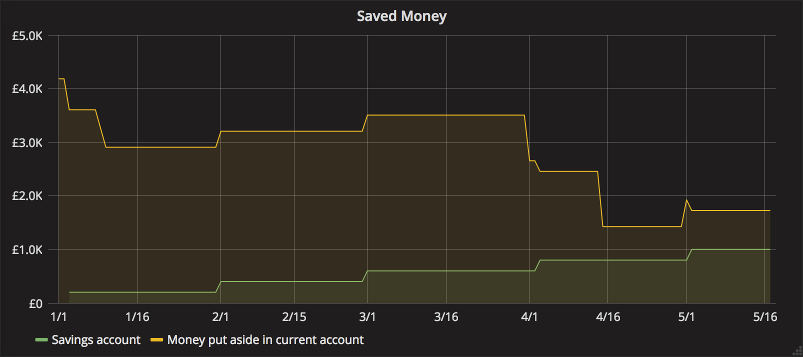
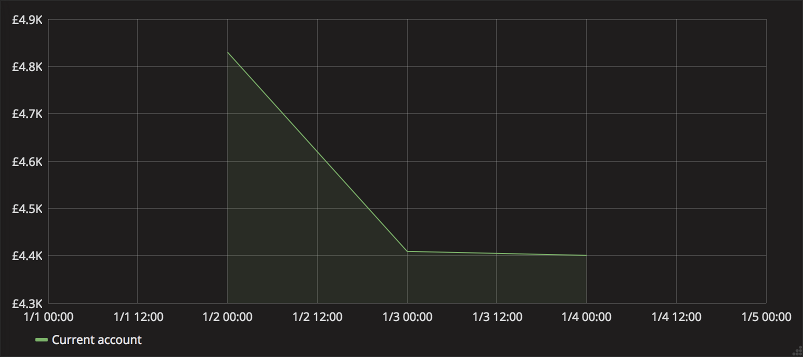
Here’s what the graph from the start looks like:
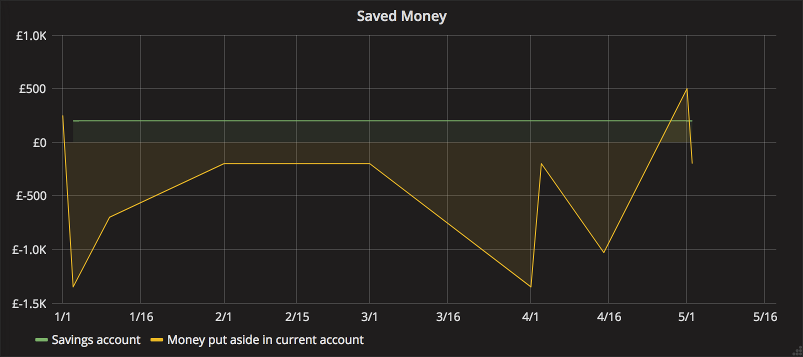
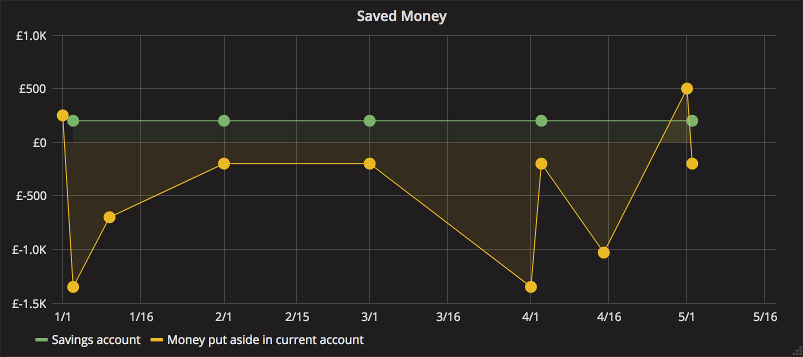
A bit weird, but it makes sense. We’re only reporting the deltas after all. It’s also a little misleading, as I’m not continuously depositing £200 into my savings account, only once a month. Turning on points in the graph display illustrates this:
Reporting totals
Grafana does have a cumulative_sum operation, but I couldn’t figure out how to get it working. To avoid me having to learn how to use my tools, the next step is to report both the total and the delta:
toMeasurements :: [H.Transaction] -> [I.Line UTCTime]
toMeasurements = concat . snd . mapAccumL toInflux M.empty

toInflux :: M.Map I.Key Double -> H.Transaction -> (M.Map I.Key Double, [I.Line UTCTime])
toInflux bals txn = (bals', map toLine [("total", fieldsT), ("delta", fieldsD)]) where
  toLine (k, fs) = Line k tags fs (Just time)
  time    = UTCTime (H.tdate txn) 0
  tags    = M.singleton "description" (fixup (H.tdescription txn))
  fieldsT = fmap I.FieldFloat bals'
  fieldsD = fmap I.FieldFloat deltas
  bals'   = M.unionWith (+) bals deltas
  deltas  = toDeltas txn
This looks more complex, but really isn’t. We just use the mapAccumL3 function to keep a running total, and return two Line values rather than the one.
Now, by using the “total” measurement rather than the “delta”, we get the graph from the start. The deltas are still available in case they’re useful.
Daily aggregates
Unfortunately, this doesn’t work so well on accounts which have multiple transactions on a single day. This is because we report all our daily transactions as happening at the same instant, which makes the graph look a little odd. Here’s my current account on the 3rd of January:
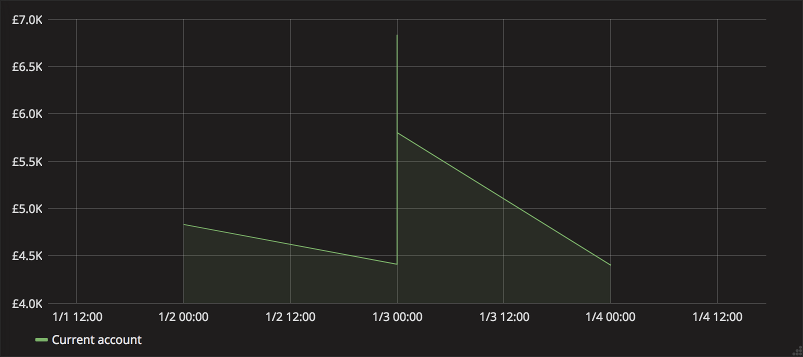
We can get the transactions for that day from InfluxDB with a query in its SQL-like language:
SELECT description, assets FROM total WHERE time = '2017-01-03'We get these points:
eSaver_initial        4885.6900000000005
Grandma_inheritance   6885.6900000000005
Tuition               5855.6900000000005
Holgate_rent          4505.6900000000005
Arch_Hurd_Google_Apps 4502.9400000000005
Linode                4484.900000000001
So first we gain £2000, then we spend more than that. The lines Grafana draws don’t help matters either. Because I still don’t know how to do cumulative sums, we can solve this by reporting, in addition to the raw data, a daily aggregate:
toMeasurements :: [H.Transaction] -> [I.Line UTCTime]
toMeasurements txns =
  let daily   = groupBy ((==) `on` H.tdate) txns
      squish  = \ts@(t:_) -> t { H.tdescription = "aggregate", H.tpostings = concatMap H.tpostings ts }
      raw     = concat . snd $ mapAccumL (toInflux "raw_total" "raw_delta") M.empty txns
      running = concat . snd $ mapAccumL (toInflux "agg_total" "agg_delta") M.empty (map squish daily)
  in raw ++ running

toInflux :: I.Key -> I.Key -> M.Map I.Key Double -> H.Transaction -> (M.Map I.Key Double, [I.Line UTCTime])
toInflux keyT keyD bals txn = (bals', map toLine [(keyT, fieldsT), (keyD, fieldsD)]) where
   -- omitted
So we produce two collections of measurements: the raw and the daily aggregate. Now the 3rd of January looks sensible:
Graphs
Now we can graph pretty much any aspect of our finances. Like…
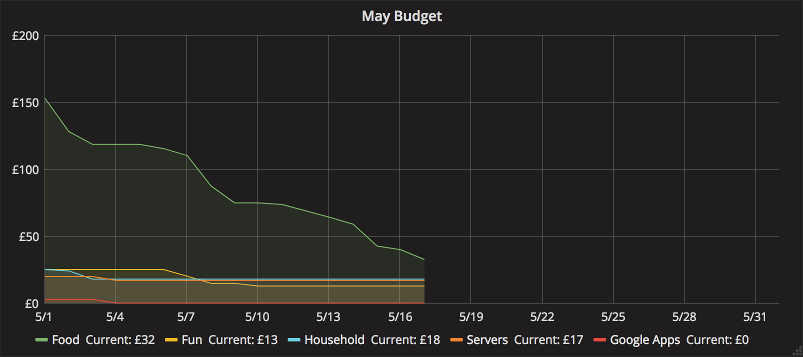
The monthly budget4:
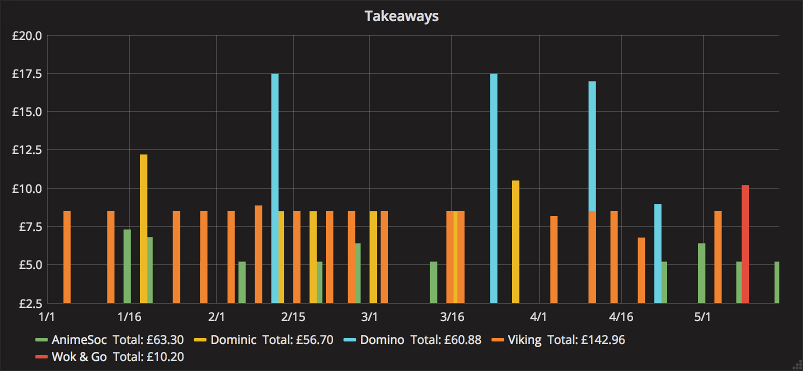
Takeaway purchases (by filtering on the description):
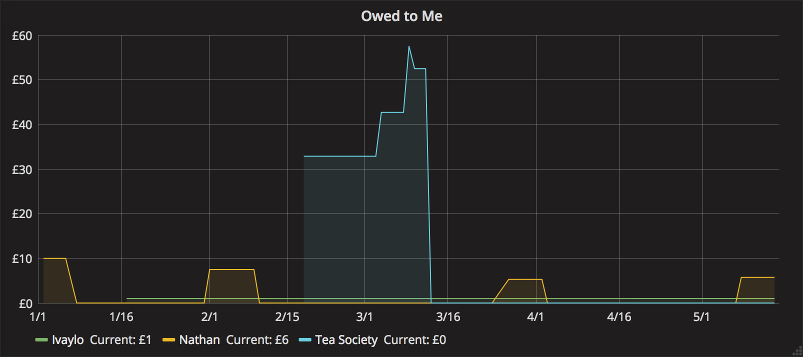
Money I am owed:
I’m not sure if I’ll keep exporting my journal changes to InfluxDB, but this could be a good way to spot longer-term trends. It’s certainly a nice way to get a quick summary of what’s happening.
Arguably, it should be 23:59 rather than 00:00, as the transactions happen by the end of the day, not at its start. It doesn’t matter too much as long as we’re consistent.↩︎
Yes, yes, floating point for currency is bad. This is only the type we use for metric reporting, hledger uses exact decimal values internally.↩︎
I always feel slightly excited when I use
mapAccumL. It’s such an exotic function!↩︎Don’t worry, I have several days of food in the fridge/freezer. I’m not on the brink of starvation.↩︎